
The July–September 2026 quarter was one of the Bank’s best: profit up 30%, loans up 18.5%, and margins and returns that now lead its larger public sector peers. But deposits are growing at just over a third of the pace of loans, and part of today’s effort is still repairing the damage of 2022–25. This article explains, in plain terms, where we stand, how we got here and what each of us can do.
Q2 FY27: What the Numbers Tell Us
The headline: a much better quarter
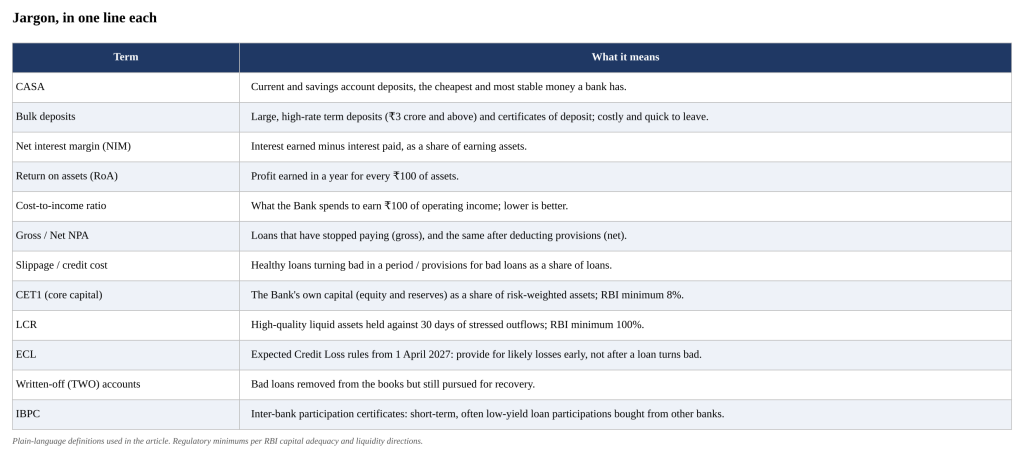
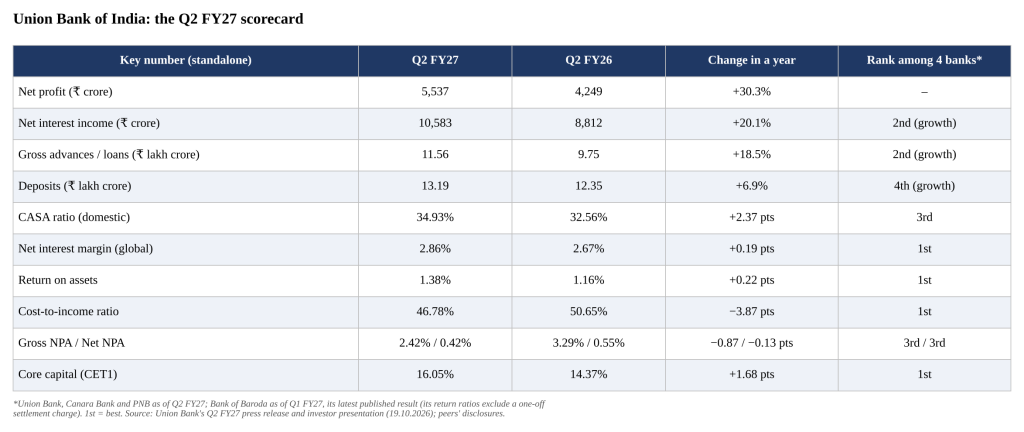
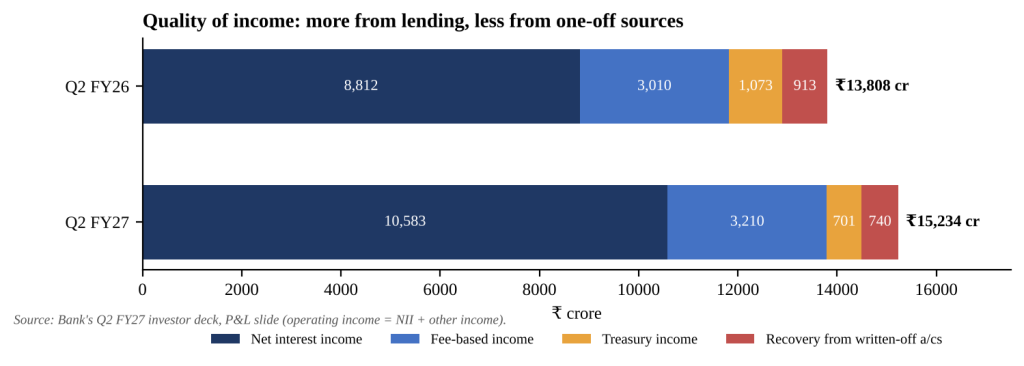
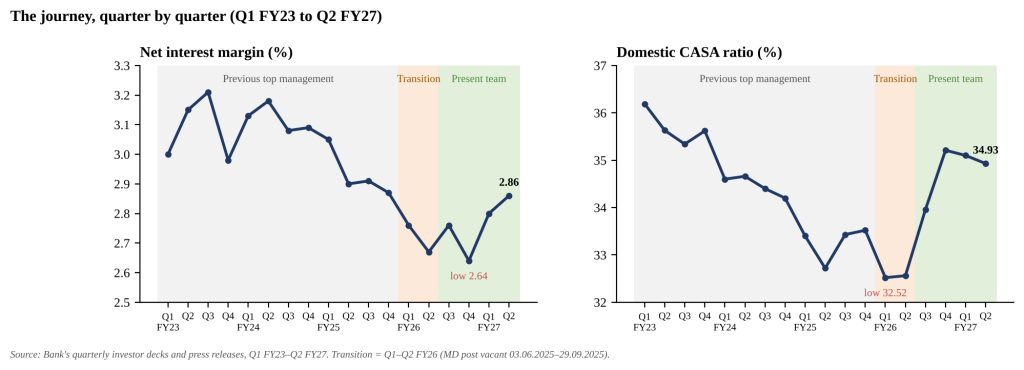
The Bank earned a net profit of ₹5,537 crore, up 30.3% on a year ago. Its main earning engine, net interest income (interest earned on loans and investments minus interest paid on deposits), rose 20.1% to ₹10,583 crore. Loans grew 18.5% to ₹11.56 lakh crore. The net interest margin, the gap between what we earn on our money and what we pay for it, improved from 2.67% to 2.86%, because the cost of our deposits fell (to 5.01%) faster than the yield on our loans (7.90%). Every ₹100 of assets now earns ₹1.38 of profit a year (return on assets), the best of the four large public sector banks we compare against. And we spent ₹46.78 to earn every ₹100 of operating income, down from ₹50.65 a year ago (cost-to-income ratio).
Where the extra profit came from
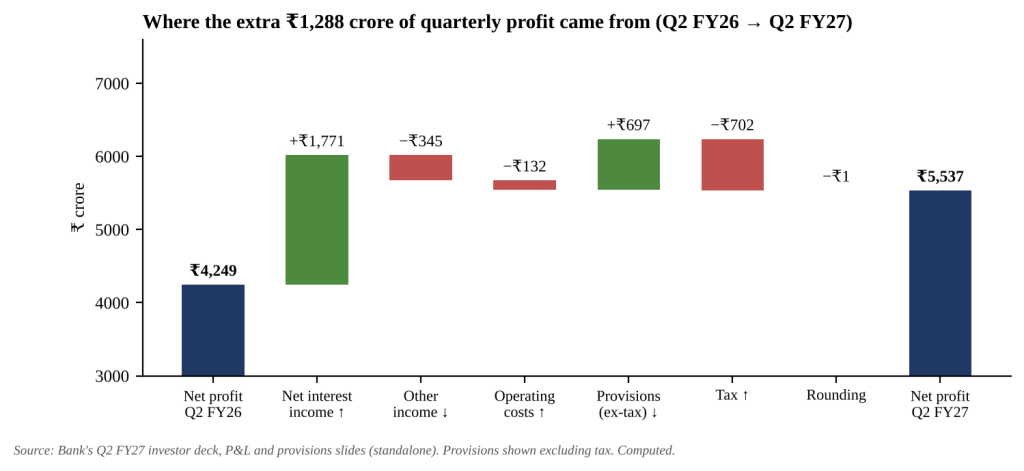
The chart below breaks down the ₹1,288 crore rise in quarterly profit. Most of it came from higher net interest income (+₹1,771 crore) and lower provisions for bad loans (+₹697 crore). Against this, other income fell by ₹345 crore (mainly lower treasury gains and lower recoveries from written-off loans), operating costs rose by ₹132 crore, and tax rose by ₹702 crore.
The quality of profit has improved
A bank’s profit is healthier when it comes from regular lending, not from one-off gains. On that test this quarter is strong. If we set aside treasury gains and recoveries from written-off accounts, operating profit rose 38.1% to ₹6,667 crore. Those two one-off sources fell from 14.4% to 9.5% of operating income.
What we lend and how we fund it
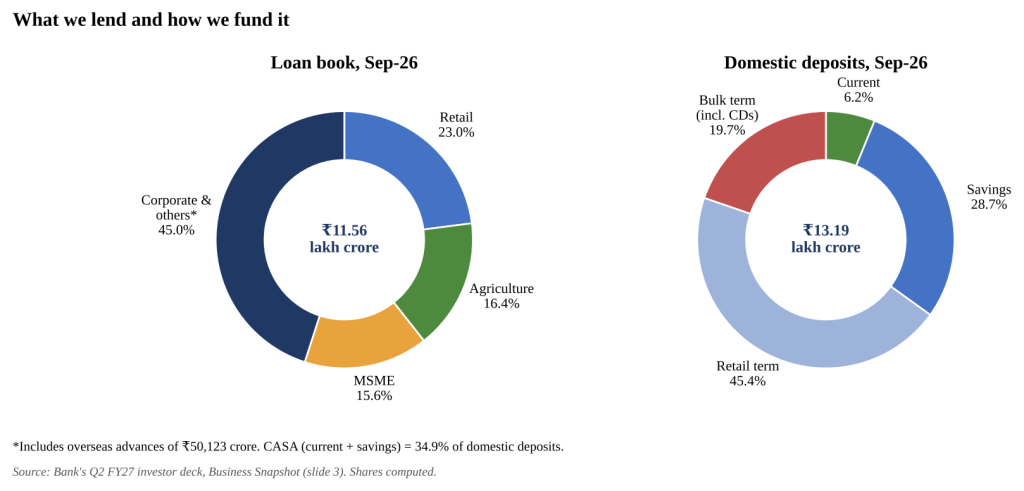
Retail, agriculture and MSME (RAM) loans make up 55% of the loan book, and corporate and other loans 45%. Corporate and others grew fastest this year (+23.6%), followed by MSME (+22.4%). On the deposit side, current and savings accounts (CASA, the cheapest money a bank has) form 34.9% of domestic deposits, up from 32.6% a year ago. Costly bulk deposits are down to about 20%, from about 27% in earlier years.
Asset quality and capital: solid
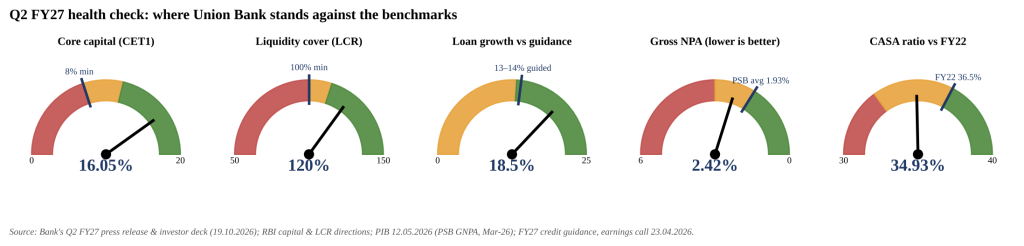
Gross NPA (loans that have stopped paying) fell to 2.42% and net NPA (after provisions) to 0.42%. Provisions cover 95.2% of bad loans. Fresh slippages, healthy loans turning bad, were ₹1,856 crore in the quarter against ₹1,985 crore a year ago, and the early-warning book of large stressed loans (SMA above ₹5 crore) shrank from ₹5,634 crore to ₹2,282 crore. Core capital (CET1) of 16.05% is 8.05 percentage points above the regulatory minimum of 8%, the strongest of the four banks.
Three cautions
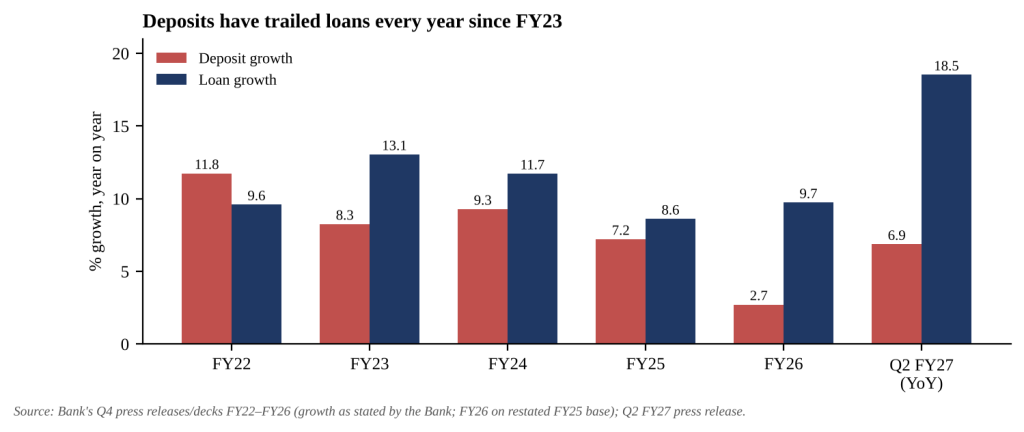
- Deposits are not keeping up. Deposits grew 6.9% against loans at 18.5%. For every ₹100 of new loans in the year, only ₹47 of new deposits came in. The domestic credit-deposit ratio rose from 77.0% to 84.3%, so loans are partly being funded by running down surplus liquidity.
- Bad-loan costs are unusually low. Credit cost was just 0.21% of loans. If it returned to the FY24–25 average of about 0.76%, return on assets would be nearer 1.1% than 1.38%. The Bank’s own ‘core RoA’, excluding treasury and written-off recoveries, is 1.03%.
- The ECL test is coming. From 1 April 2027, banks must provide for expected losses before loans turn bad (Expected Credit Loss rules). The Bank estimates it needs about ₹6,000 crore more, roughly 0.75 percentage points of core capital. That is affordable, and RBI allows it to be phased in over four years.
How We Got Here: The 2022–25 Years
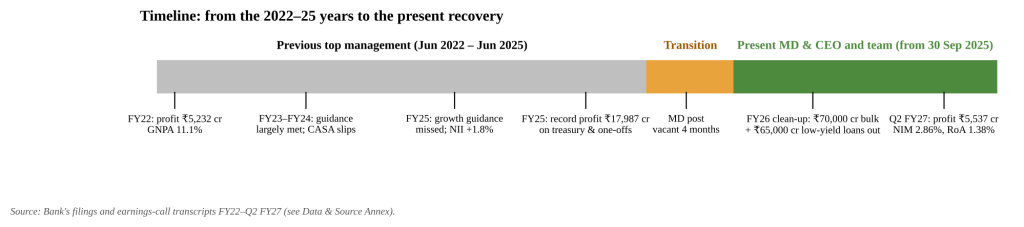
To understand today, we must be honest about the three years under the previous top management (June 2022 to June 2025). They were not a failure on every count. Net profit rose from ₹5,232 crore (FY22) to ₹17,987 crore (FY25), gross NPA fell from 11.1% to 3.6%, margins rose in FY23–FY24, recovery targets were beaten in FY23 and FY24, and the government’s EASE reform index placed the Bank in its top three.
The weakness was in the franchise, the base of customers and cheap deposits on which a bank’s future rests. The CASA ratio slid from 36.5% to 33.5%. CASA fell at all four banks, and since FY22 Union Bank’s has fallen less than Canara’s, PNB’s or Baroda’s, but the slide still raised our cost of funds. Bulk deposits stayed about 27% of the book until management began shedding them in FY25 (over ₹30,000 crore by December 2024). The margin fell from 3.10% in FY24 to 2.87% by the last quarter of FY25.
FY25 exposed the strain. Loans grew 8.6% against a promised 11–13%, and deposits 7.2% against 9–11%. Slippages and recoveries both missed their targets; slippages would have been within target but for one large PSU account (about ₹3,300–3,600 crore) that turned bad in a single quarter. Management said it had chosen not to chase low-yield loans. Net interest income grew just 1.8%. The record profit leaned on treasury income of ₹4,186 crore, ₹787 crore recognised on NARCL security receipts, interest on income-tax refunds and sales of priority-sector lending certificates (₹955 crore in one quarter). Segment figures also flattered the picture. MSME gross NPA halved partly because ₹12,000–13,000 crore of loans without Udyam registration was moved out of the MSME category. Agriculture NPA, though down from about 12%, stayed near 8%. In mid-2024, before RBI had issued even draft ECL rules, management expected no major ECL impact; under the final rules the Bank now estimates it needs about ₹6,000 crore more.
The Dent, in Numbers
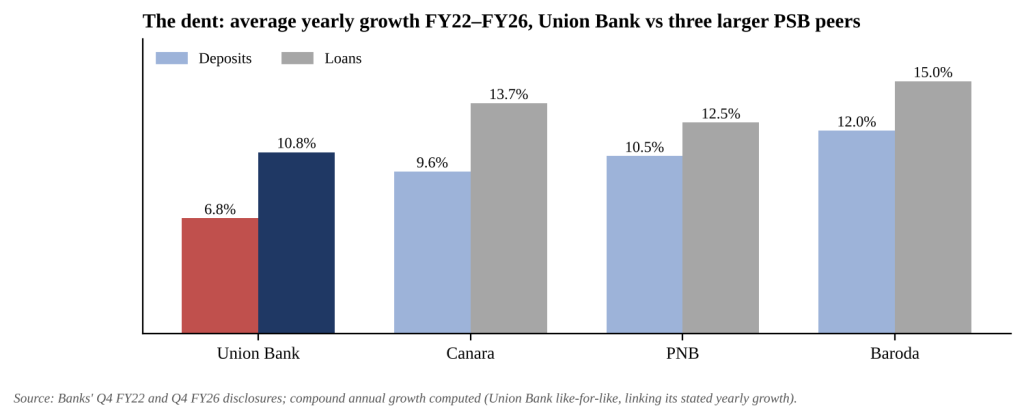
Measured fairly (like-for-like), Union Bank’s deposits grew by an average of 6.8% a year from FY22 to FY26, and total business by 8.5%. Canara, PNB and Baroda grew deposits by 9.6–12.0% a year and business by 11.3–13.4%. Had the Bank simply kept pace with them, it would by March 2026 have held about ₹2.1 lakh crore more in deposits and ₹3.3 lakh crore more in business. Its share of the four banks’ combined business fell from 23.7% to 21.2%, and the gap behind Canara, the next-largest public sector bank, widened from ₹0.8 lakh crore to ₹4.2 lakh crore. FY26, mostly after the change at the top, included the deliberate bulk run-down, which accounts for part of that gap.
Why the Recovery Takes Time
The present MD & CEO and team, in office since 30 September 2025, have speeded up the unwinding of the old balance sheet. About ₹70,000 crore of costly bulk deposits was shed in FY26, ₹35,000 crore of low-yield inter-bank participation certificates (IBPC) was exited and ₹30,000 crore of loans earning below 6% was run off. That clean-up is the main reason FY26 deposits grew only 2.7%, while the margin, squeezed by 125 basis points of repo-rate cuts, touched 2.64% in Q4 FY26. The present MD & CEO has said growth must now rest on a robust base ‘rather than only on the superficial foundation’, and that the full benefit of the changes could take nine months to a year.
Three drags remain. Deposits still trail loans. Agriculture still carries 6.86% gross NPA. And the ECL rules will need about ₹6,000 crore more. None of these is a crisis, but each will slow the climb unless tackled directly.
How We Compare: Peers, Regulator and Market
Against Canara and PNB (Q2 FY27) and Baroda (Q1 FY27), Union Bank now leads on margin (2.86% against 2.55–2.77%), return on assets (1.38% against 1.05–1.10%), cost-to-income (46.8% against 47.8–50.5%) and core capital (16.05% against 12.80–14.44%). It is last on deposit growth (6.9% against 9.9–13.8%) and third on CASA and gross NPA. A regulator would see ample capital, net NPA far below the 6% danger level in RBI’s Prompt Corrective Action framework, and an average liquidity coverage ratio of 120% against a 100% minimum. The market has noticed: the Bank’s own figure puts its share price at 1.01 times book value on 30 September, against 0.90–0.96 for the peers on market data. The next step up in valuation needs deposits.
The Road Ahead: Five Priorities
- Deposits first. Grow deposits at least as fast as loans; the gap today is 11.7 percentage points. Each one-point rise in the CASA ratio brings in about ₹13,200 crore of low-cost funds.
- Finish the asset-quality job. Bring gross NPA (2.42%) below the public sector bank average of 1.93% (March 2026), starting with agriculture (6.86%).
- Earn fees, not windfalls. Close the 0.35 percentage-point gap between reported (1.38%) and core (1.03%) return on assets with regular fee income.
- Restore control credibility. Allow no repeat of RBI findings on asset classification, farm-loan collateral or e-banking disputes.
- Recover from the ₹71,000 crore written-off pool. First-half recoveries were ₹1,483 crore, down 15.9%; each ₹1,000 crore recovered adds about ₹750 crore to profit after tax.
What It Means for Every Unionite
At the branch: every salary account, savings balance and current account is now the Bank’s scarcest raw material, so open, activate and grow them. Under the ECL rules, a loan more than 30 days overdue is presumed to be under stress and needs a much higher provision, so a follow-up call on day 31 saves capital. System asset classification must never be altered by hand.
At the region: track the 30-day overdue list and early-warning accounts every week, put the quality of agriculture and MSME sanctions ahead of volume, and pursue written-off recoveries case by case.
At the corporate office: price deposits for their true liquidity cost, build fee-earning products, and complete the ECL models and data. Profit alone does not build a franchise; rebuilding it is everyone’s job.
Jargon, in one line each